 Nexxt
NexxtEngineered on paper before anything is built.
Every site and every panel starts as a drawing set: one-lines, load calculations, grounding and protection, sized for the worst week of weather the site will see. The crew installs to the drawing. The as-built comes back to you in AutoCAD.
What you get back, by phase.
Engineering is priced by deliverable, so you know what is in the package before it is issued.
Site assessment
- Existing power, grounding and enclosure condition
- Sky view and cellular signal survey
- Load inventory and duty cycle
- Hazardous-area classification check
- Photo record and redline of existing drawings
Issued for construction
- One-line diagram and panel schedule
- DC load calculation and autonomy sizing
- Solar array and battery bank sizing
- Grounding and bonding plan
- Surge and lightning protection coordination
- Enclosure layout, wiring diagrams, BOM
As-built package
- Redlines incorporated, AutoCAD native and PDF
- Test records and FAT sign-off
- Ground resistance and signal measurements
- Labeled photo set
- Attached to the site record in SkyView
A solar RTU site, sized.
The one-line below is the shape of most unpowered sites we build. The numbers are typical, not a real design. Your site gets its own.
- Average load 40 W, peak 110 W during transmit
- Five days autonomy at 50% depth of discharge
- Array sized to the worst month of insolation, not the average
- Charge controller with temperature-compensated absorption
- Surge protection on PV input, DC bus and every field cable
- Ground ring at 5 Ω or better, measured and recorded
- Breakers sized for wire, not for the load
- −40 °C rated batteries and enclosure heater where required
Real as-builts, drawn the way your standards want them.
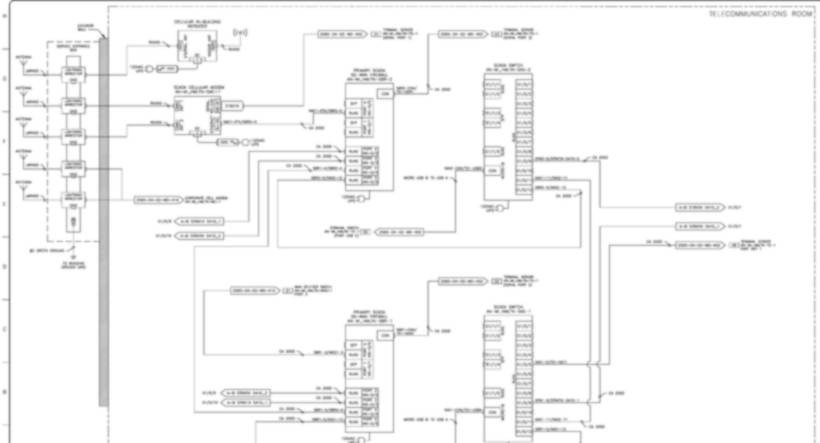
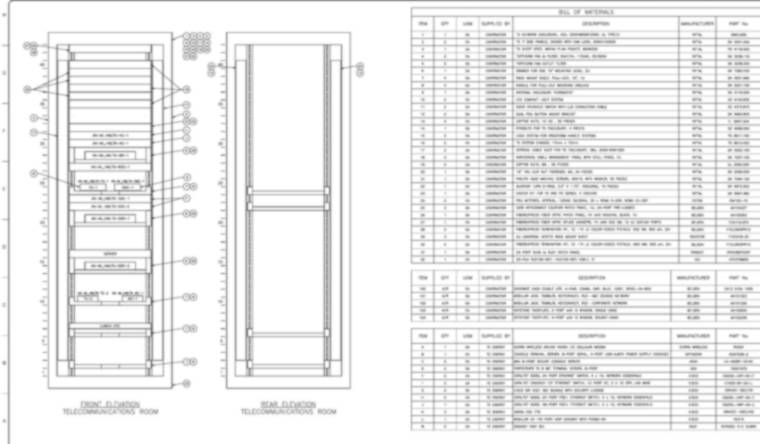
Two sheets from a recent telecom as-built set: a network interconnection diagram and a rack elevation with bill of materials. Customer, site and device identifiers removed.
The algorithm, and a calculator you can try.
This is the method behind every solar-powered enclosure we build. Change the inputs and watch the design change. Real designs add site insolation tables, temperature derates and a margin review by an engineer.
Illustrative. Battery chemistry, temperature curves, array tilt and local insolation change the numbers. Ask for a site-specific design.
Wh/day = avg W × 24Wh_bank = Wh/day × days ÷ DoD ÷ cold derateAh = Wh_bank ÷ V, round up to stringW_array = (Wh/day + usable Wh ÷ recharge days) ÷ (sun h × (1 − system losses))A = W_array ÷ V × 1.25, MPPTBreaker = peak W ÷ V × 1.25, wire sized to breakerWhen the site needs more than a drawing.
Grounding & bonding audits
Fall-of-potential testing, bond verification and a remediation list ranked by risk to equipment. The single biggest cause of storm losses at remote sites.
Surge coordination
Device selection and placement across power, I/O and communications so the protection cascades correctly instead of sacrificing the RTU.
Link budgets & path studies
Satellite look angles and rain margin, cellular RSRP surveys, and licensed or unlicensed radio path studies for backhaul.
Class I Division 2 design
Equipment selection, wiring methods and enclosure ratings for classified areas at gas sites, documented for your inspector.
Site standards
A typical drawing set for your fleet so every new site is built the same way and every technician knows where to find things.
Start with a survey.
One visit, one report, and a drawing set you can build from or put out to bid.